Andrew Mendez

Welcome!
My name is Andrew and I am currently transitioning into the world of data from 10+ years in the restaurant industry. Here are the projects I've been working on!
View My LinkedIn Profile
HR Nightmare: Arguing Attrition
Using R

This is the 5th Project that I posted working through the Data Analytics Accelerator Bootcamp led by Avery Smith. I used R to come up with these insights.
Recently, I was brought onboard a team to analyze the company’s HR data. They’ve had a lot of staff leaving the company and they want a better insight as to why this is happening. This is extremely powerful knowledge to have at your disposal! I used R to help calculate p-values and other predictive data to help the company get some answers.
So I went to work on the following:
- An overview of how some of the most important demographics correlate.
- Is the recent attrition attributed at all to age?
- Is the majority of the recent attrition rates from the most recently hired staff?
- What is the statistical significance of “age” and “monthly income” within the company? What if we add “total working years”? Is this a good predictor of monthly income?
The Data
You can find the data I used for this analysis here.
This dataset include 1470 rows (each representing one employee) and 35 columns (demographic info).
Key Insights
Here are the most interesting findings from my analysis:
- There is a statistically significant correlation in predicting Monthly Income from two variables: Age & Total Working Years.
- There was no statistical significance between the AGE or TIME OF HIRE for the employees at this company and whether or not they stayed or left the company (voluntary or otherwise).
- The company could begin building messaging to its current employees about the possibility of increased income in relation to their loyalty to the company to help retain the employees that they do have.
The Analysis
An overview of how some of the most important demographics correlate.
First, I wanted to get a “bird’s eye view” of some of the most important demographics for the company. They asked me to include: age, daily rate, distance from home, education, hourly rate, monthly income, monthly rate, number of companies worked, total working years, and training times last year.
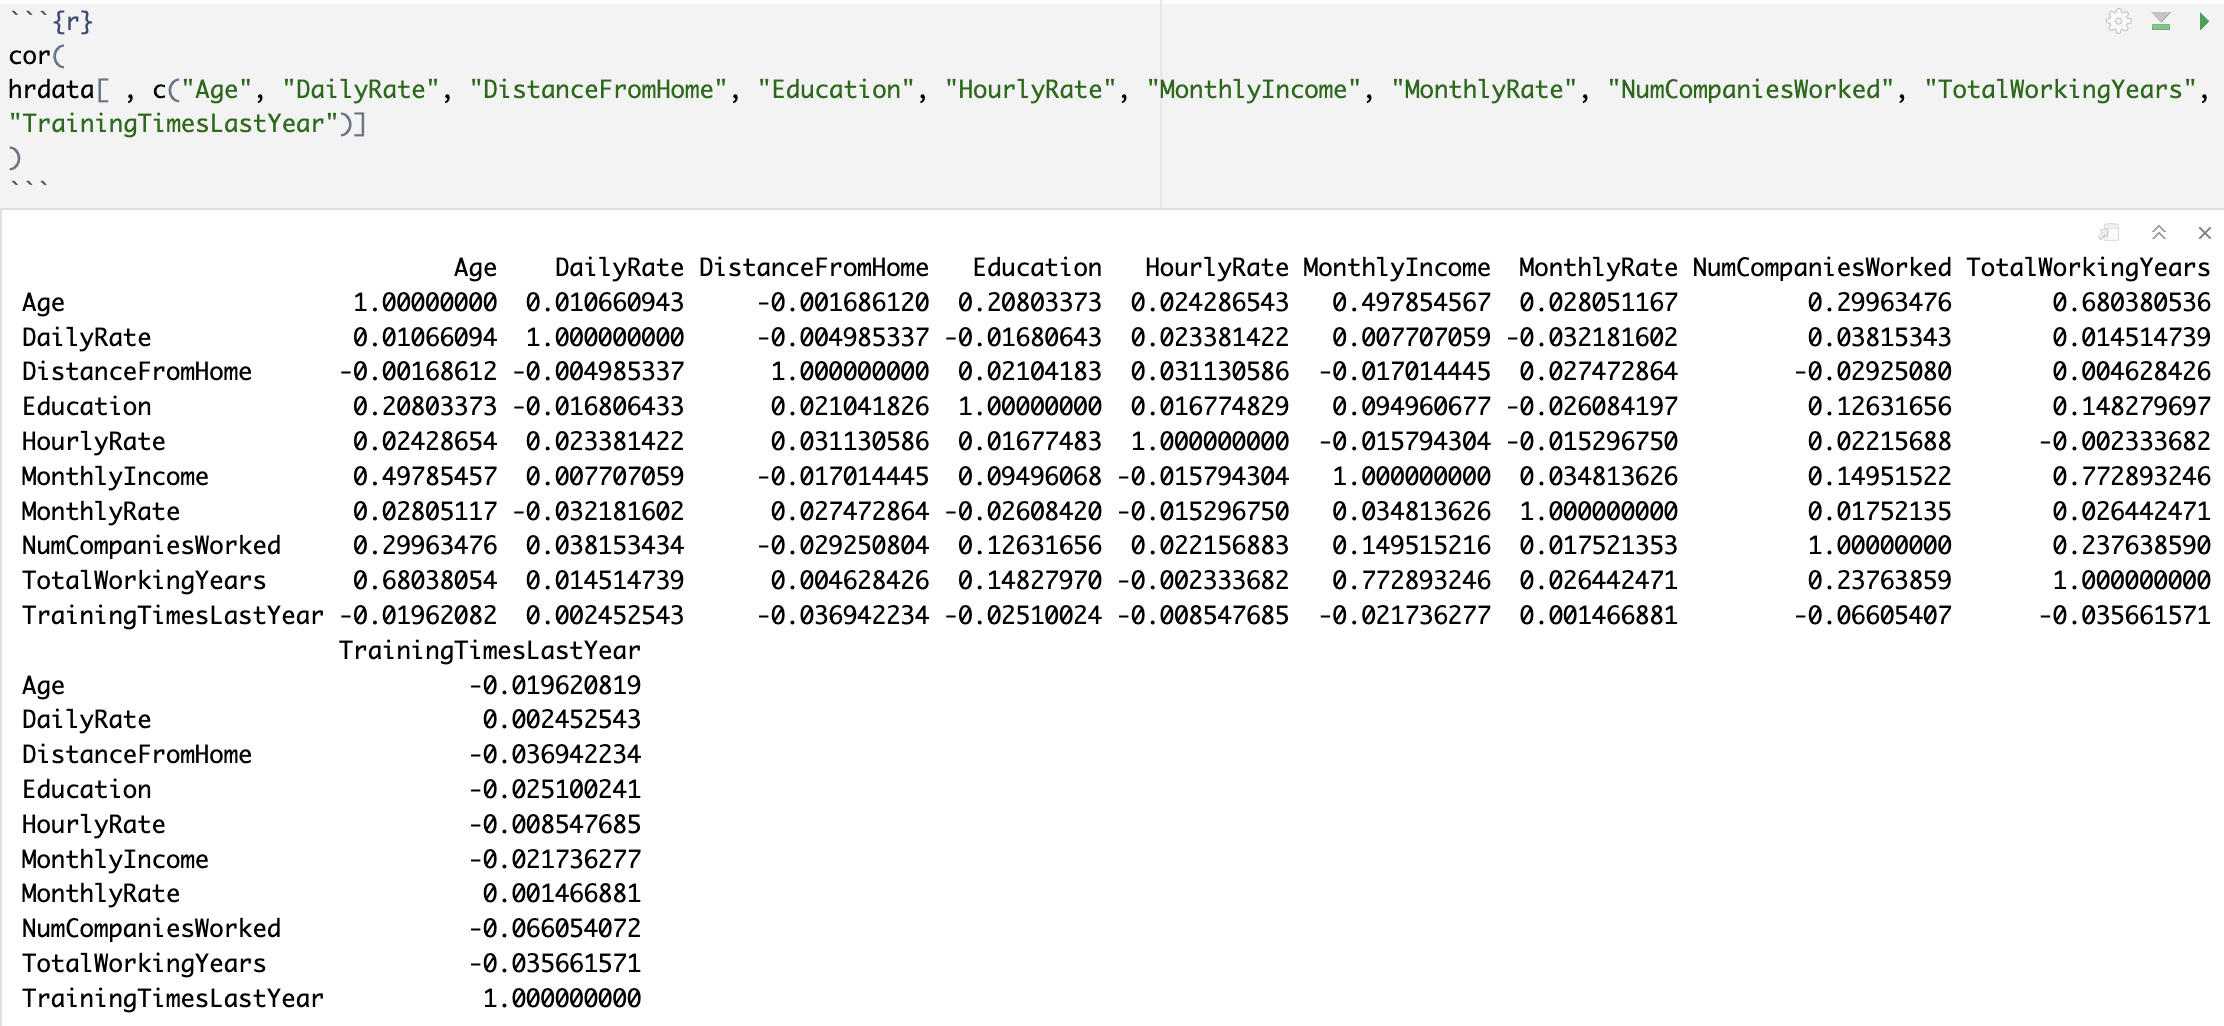
I translated this information into this Pairplot matrix:
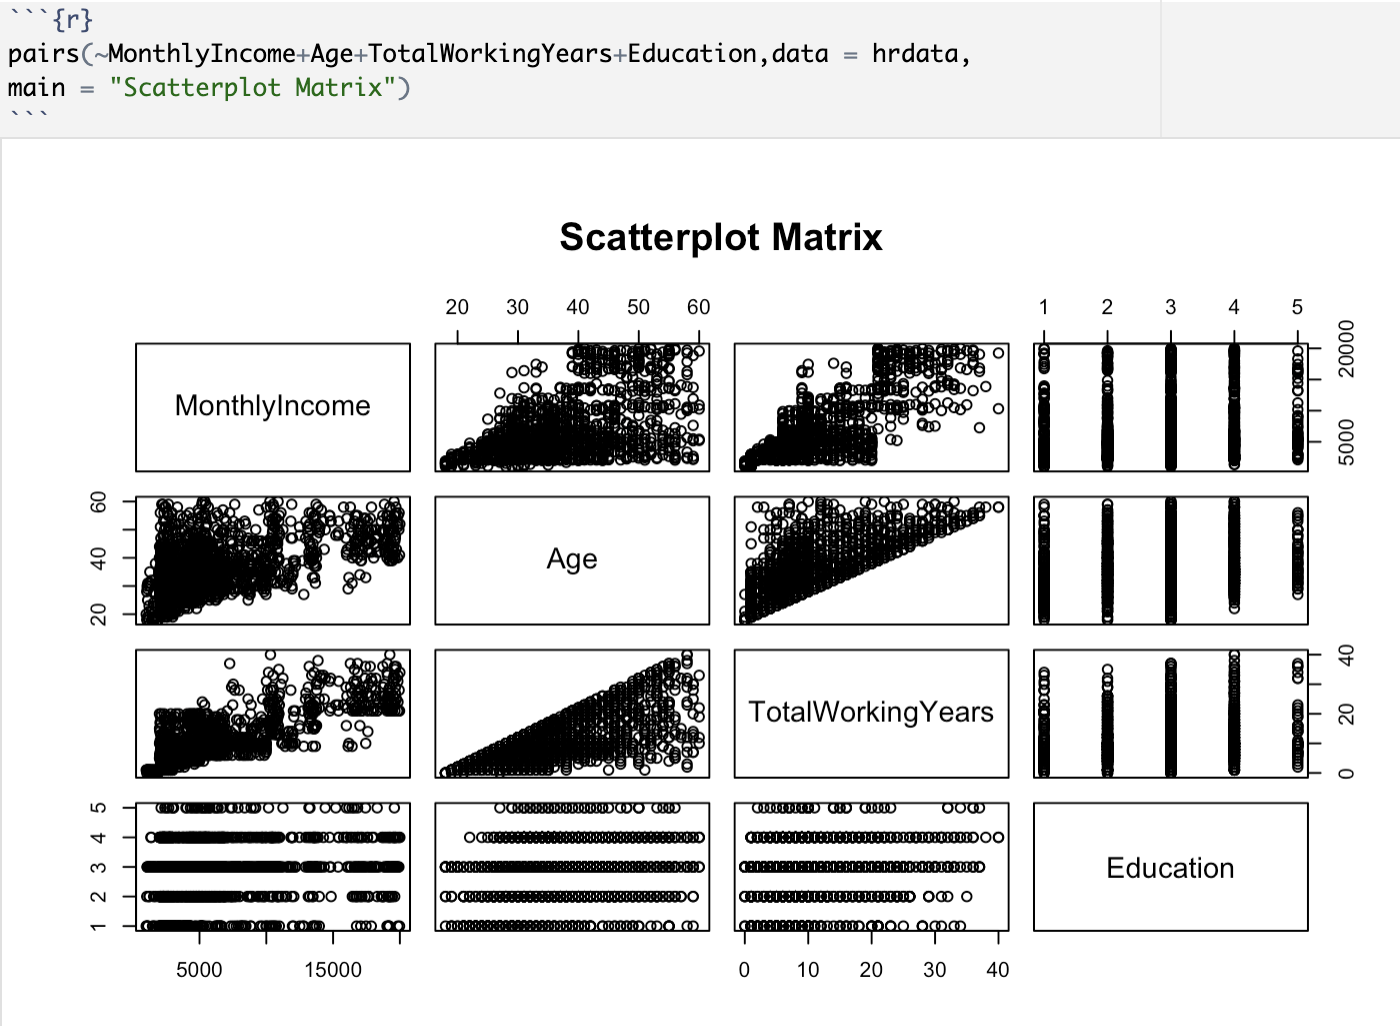
Based on the visualizations in the matrix, the only real relationships presenting some kind of linear relationship are Age, Monthly Income, and Total Working Years. I looked further into these relationships later in my analysis.
Is the recent attrition attributed at all to age?
A disgruntled employee who was recently laid off threatened to sue the company on the claim that the company was sexist in its decisions on who to “let go”. I was asked to analyze this and see if it was actually true.
I decided to return a box-and-whisker plot for the employees who have stayed with the company and for those who left.
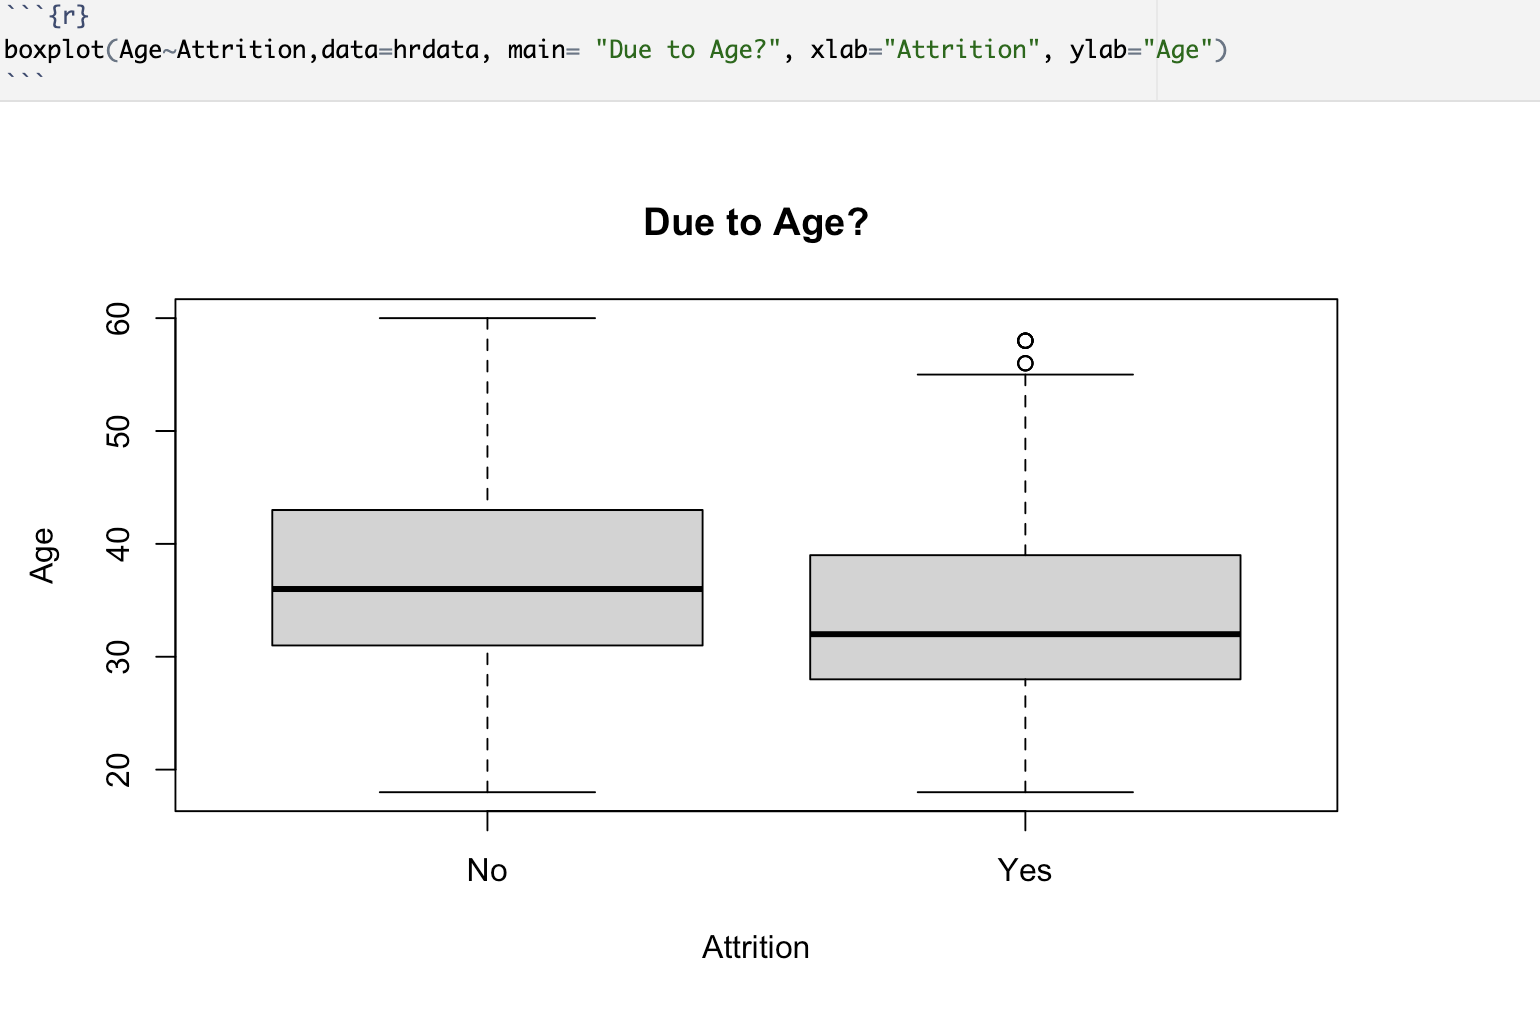
In the box & whisker plot, we can see that the median age of people who left the company (whether voluntarily or otherwise) is actually lower than the median age of those who are still employed. In other words, more of the employees who actually left the company were younger than those who stayed.
At first glance, it seems that it was actually the opposite where the younger employees were being let go. I ran a t-test to see if there was statistical significance:
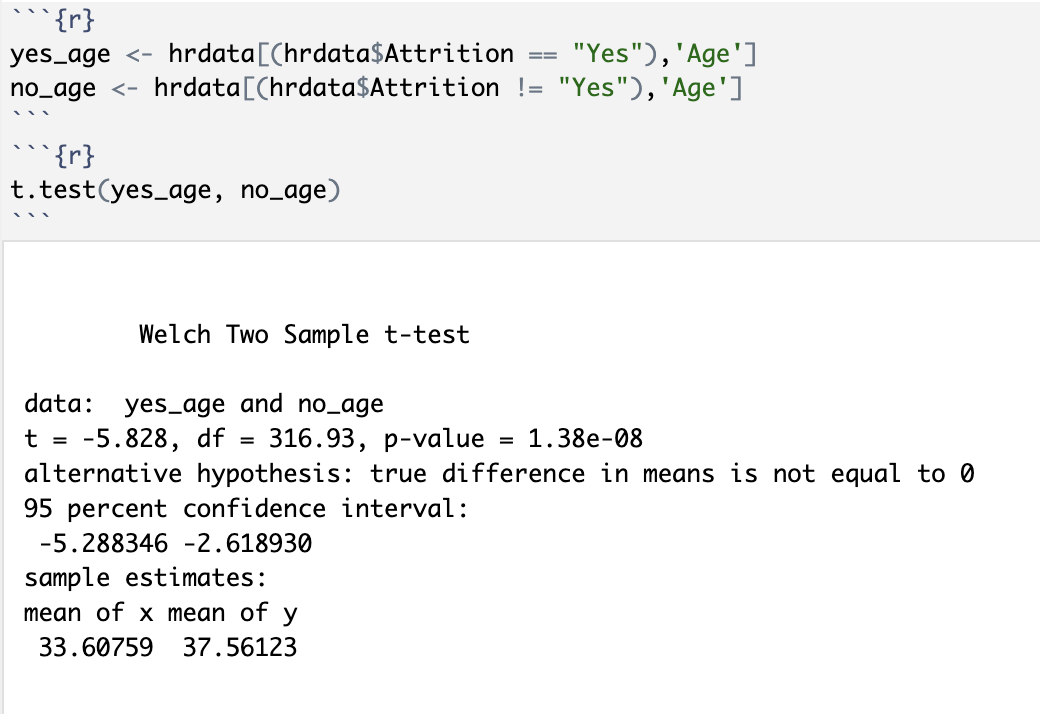
Here we find that the p-value for these two variables is well below the 0.05 threshold of statistical significance. This allows us to reject the null hypothesis and say with at least 95% certainty that there is, in fact, a statistical significance between those employees who were laid off and those who still work at the company. This is great news and great data to present as a defense for the accusation that the company’s disgruntled ex-employee made about sexism inside their walls.
Is the majority of the recent attrition rates from the most recently hired staff?
There was a question as to whether the most recent employees were first on the chopping block. I used the same functions and replaced the “Age” for “Employee Number”. (In this company, the employee numbers are associated with their hire date)
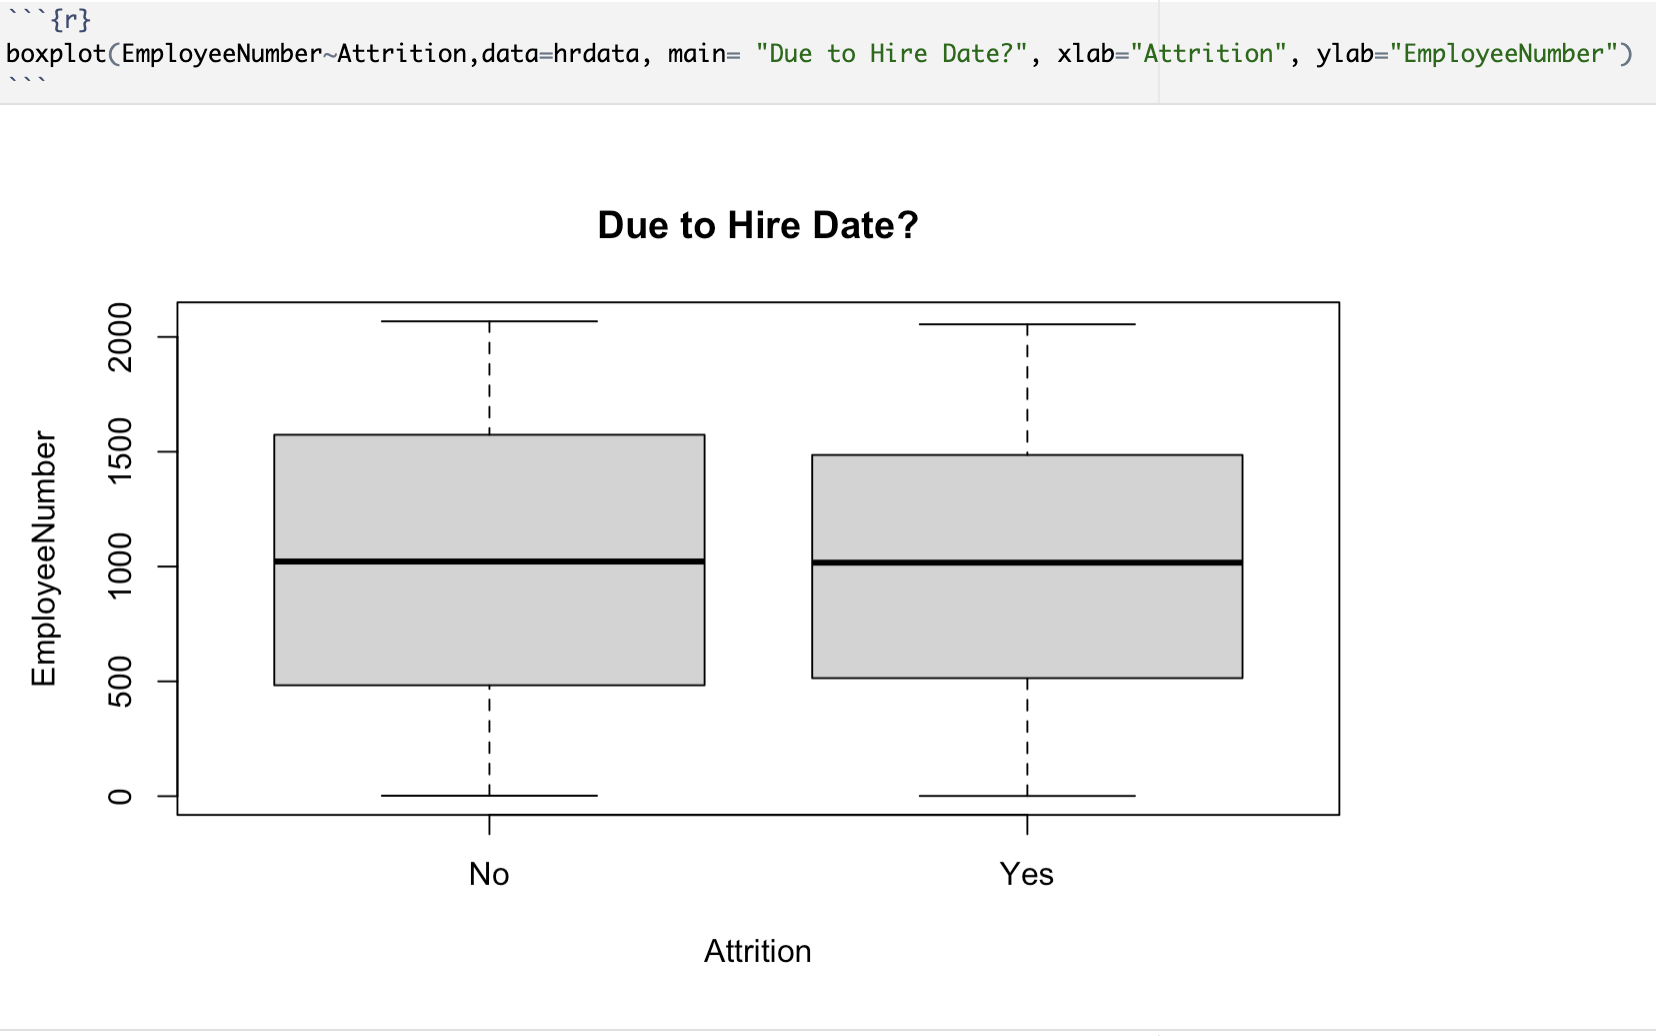
Based, solely, on this visualization above, it seems that there is no relationship between staying at the company and the Employee Number. But to be absolutely sure, I ran another t-test:
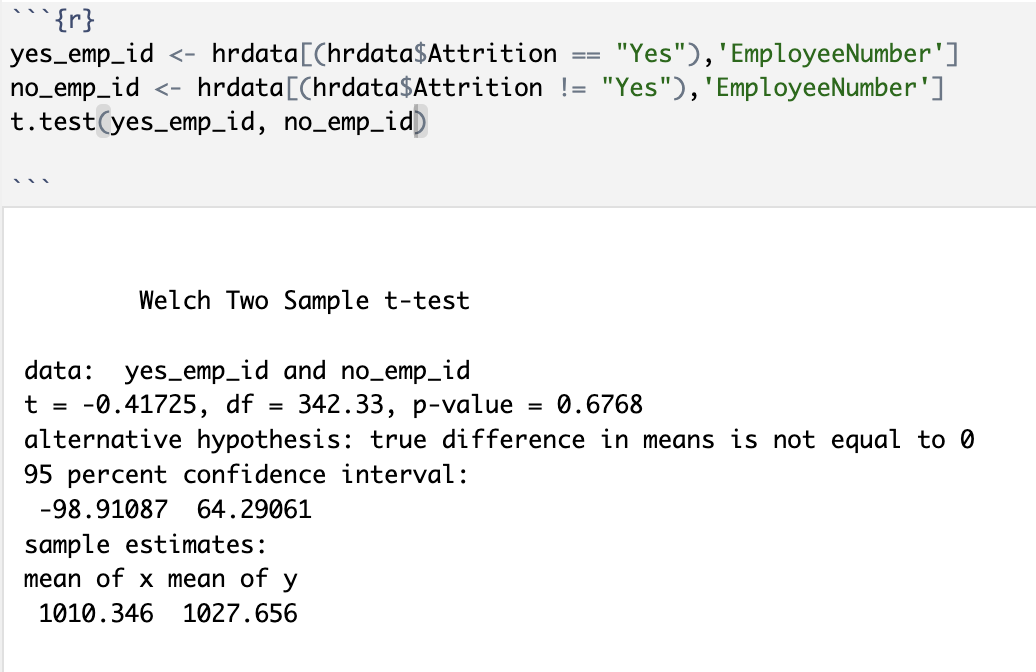
Here, we can be certain, because of the p-value of 0.68, that we can ACCEPT the null hypothesis and say that there is no statistical significance between the employees staying with the company and their company ID.
What is the statistical significance of “age” and “monthly income” within the company? What if we add “total working years”? Is this a good predictor of monthly income?
In an effort to offer the company data that can support campaigns to retain their employees, I rounded up some data on the factors associated with gaining more income.
First, I looked at “Age” and “Monthly Income” to see if that played a roll:
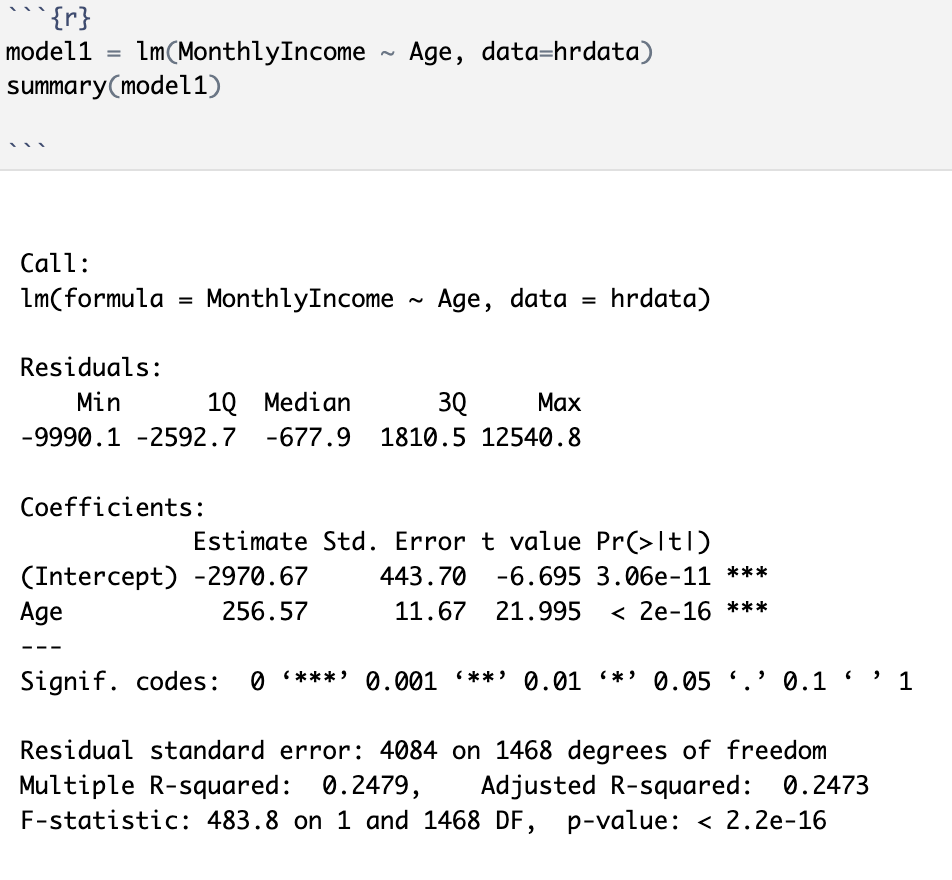
In this first model, we see a p-value of 2.2e16 which is under that 0.05 threshold meaning that there is a statistical significance between “Age” and “Monthly Income”. The R-squared value is 0.2479, meaning that this model can explain about 25% of the variance between these two variables.
I went a step further and added another variable to the mix: “Total Working Years”. After running the same test with this added variable, here’s what I found:
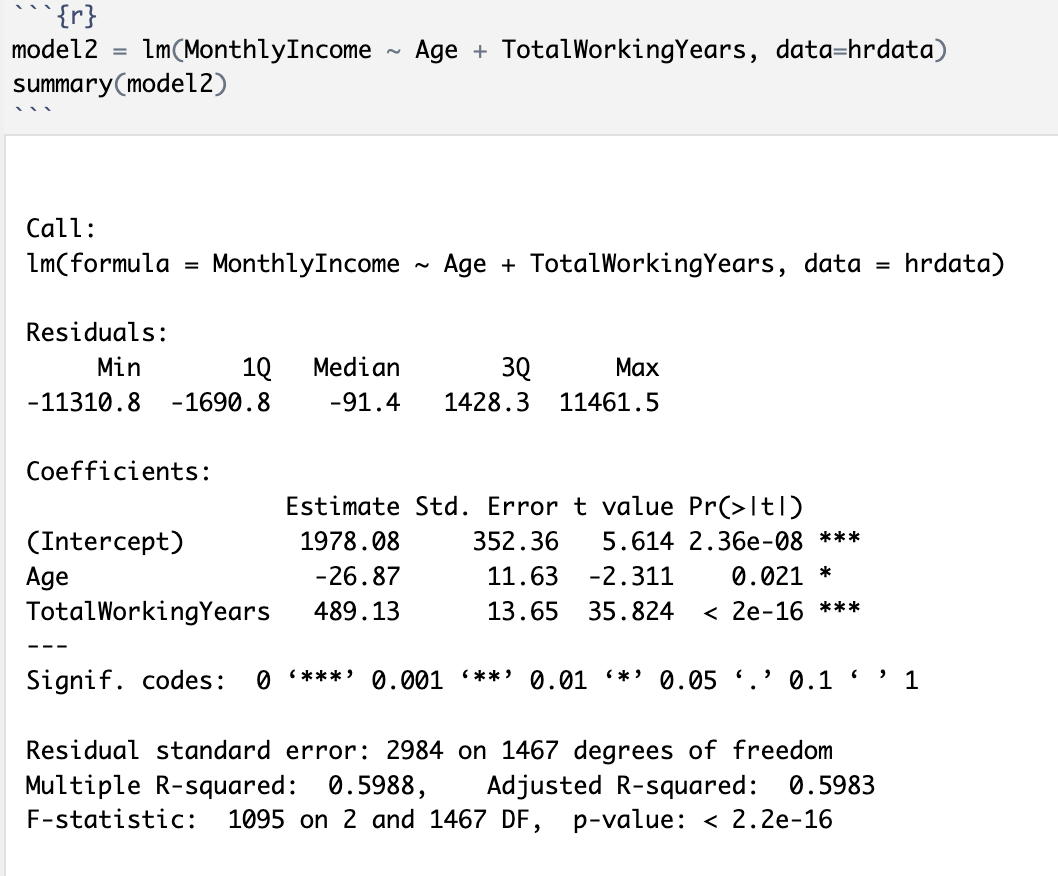
We see another low p-value (2.2c16), and an R-squared value of 0.5988 showing an even higher predictability percentage due to adding this second variable. This is showing that adding “Total Working Years” to the mix increases the R-squared value by over TWICE as much increasing its significance.
Conclusions
- For this company, the recent high attrition rates are NOT due to the employee age or time of hire.
- The company would benefit from developing campaigns to improve retention rates within the company that focus on the success they can have as they grow and remain loyal.
- Further investigation into “best practices” and company-wide cultural improvements would prove beneficial to attain the company’s goal of keeping their talent happy and loyal to them.
What Now?
This project is part of a Data Analytics Bootcamp ran by Avery Smith. Thank you Avery for putting this bootcamp out into the world and allowing people from any place in their life to dive into the world of data!
I’m currently seeking a Data Analyst role and continually learning and improving my data skills through this bootcamp and other incredible resources available on the web. Please give any feedback you have to help build and refine my toolbelt!
Please contact me with any inquiries!
Email: andrewmendez519@gmail.com